


Electric car market statistics
Published August 12, 2026
- BEVs reached a 30.0% share of new car registrations in June 2026, the highest monthly BEV share on record, as more than one in three new cars registered was fully electric.
- In Q2 2026, used BEV transactions grew 67.0% YoY to 110,761 units, with market share reaching a record 5.5%, up from 3.3% in Q2 2025.
- The SMMT's July 2026 New Car and Van Outlook projects a full-year 2026 BEV market share of 27.4%, revised up from 26.8% in the April outlook, following a stronger than expected first half.
Updated quarterly, this guide brings together the latest UK EV registration data, powertrain trends, and expert commentary for journalists, industry professionals, and car buyers.
For broader used and new car market data, see our UK car market statistics guide.
Get a free valuation
The current state of the new EV market
- In July 2026, the UK's new car market rose 11.7% to 156,571 registrations. BEVs took a 27.5% share, with PHEVs at a record 14.9% for 2026.
- June 2026 delivered the highest monthly BEV share on record at 30.0%, with 63,950 BEVs registered across a total market of 213,166 units, up 11.4% YoY.
- Private buyer demand grew 17.2% to 65,781 registrations in May 2026, taking a 40.9% market share, as consumers responded to a wider range of brands and a 6.4% increase in model choice.
Source: SMMT
July 2026 vs July 2025: Registrations by powertrain
| Powertrain | Jul 2026 | Jul 2025* | % change | Share Jul 2026 | Share Jul 2025* |
|---|---|---|---|---|---|
| BEV | 43,106 | 29,825 | +44.5% | 27.5% | 21.3% |
| HEV | 20,711 | 18,551 | +11.6% | 13.2% | 13.2% |
| PHEV | 23,359 | 17,489 | +33.6% | 14.9% | 12.5% |
| Petrol | 62,799 | 66,271 | -5.2% | 40.1% | 47.3% |
| Diesel | 6,596 | 8,018 | -17.7% | 4.2% | 5.7% |
| Total | 156,571 | 140,154 | +11.7% |
Source: SMMT
Please note: MHEV registrations are included within the petrol and diesel figures.
Key takeaways: July 2026
- Electrified vehicles (BEV, PHEV, HEV) accounted for 55.6% of July registrations, with ICE powertrains (petrol and diesel) accounting for 44.3%.
- BEVs took a 27.5% share in July, with volume up 44.5% YoY to 43,106 units. June's 30.0% share remains the highest monthly BEV share recorded in 2026.
- PHEVs grew 33.6% to 23,359 units, reaching a 14.9% share in July.
- HEVs rose 11.6% to 20,711 units, holding a 13.2% share, similar to July 2025.
- Petrol fell -5.2% to 62,799 units, with market share contracting from 47.3% to 40.1% YoY. Diesel fell -17.7% to 6,596 units, a 4.2% share.
- YTD (Jan-July), BEVs hold an estimated 25.3% market share, approximately 7.7 percentage points below the ZEV Mandate's 33% target for 2026.
webuyanycar's head of technical services, Richard Evans said:
“Three consecutive months where electrified vehicles have outsold petrol and diesel combined signals just how far and how fast the UK new car market has shifted.”
“June's record BEV share and July's strong PHEV performance are not outliers. Electric and plug-in cars are no longer the preserve of early adopters. Buyers across a much wider range of budgets are now making the switch.”
“Some buyers are going fully electric, others are choosing plug-in hybrids as a first step. The used market is following suit, with used BEV supply growing faster than any other fuel type.”
“For car buyers, that means more choice and more accessible pricing than at any point in the electric era so far. For sellers, understanding where that transition is heading and how quickly it is moving has become as important as understanding the market itself.”
Thinking of selling your EV or making the switch to electric? Enter your reg and mileage into our free car valuation tool to get a quote in under 30 seconds.
Electric car market trends: January to July 2025 vs 2026
YTD registrations by powertrain: January to July 2025 vs 2026
| Powertrain | YTD 2026 | YTD 2025 | % change | Share 2026 | Share 2025 |
|---|---|---|---|---|---|
| BEV | 327,683 | 254,666 | +28.7% | 25.3% | 21.5% |
| HEV | 182,387 | 165,328 | +10.3% | 14.1% | 14.0% |
| PHEV | 171,491 | 124,528 | +37.7% | 13.3% | 10.5% |
| Petrol | 553,794 | 571,111 | -3.0% | 42.8% | 48.3% |
| Diesel | 59,144 | 66,740 | -11.4% | 4.6% | 5.6% |
| Total | 1,294,499 | 1,182,373 | +9.5% |
Source: SMMT
YTD = 1 Jan to 31 July
Key YTD takeaways
- BEVs held a 25.3% YTD market share through July 2026, up 3.8 percentage points on the 21.5% recorded in the same period of 2025, with volume growing 28.7% to 327,683 units.
- PHEVs were the fastest growing powertrain YTD at +37.7%, reaching 171,491 registrations against 124,528 in the same period of 2025.
- Petrol and diesel both declined YTD, with petrol down 3.0% to a 42.8% share and diesel down 11.4% to 4.6%, compared with 48.3% and 5.6% respectively a year earlier.
- Total new car registrations grew 9.5% YTD to 1,294,499 units.
Source: SMMT
Key EV market developments Q1/Q2/Q3 2026
Electric Car Grant: Expansion and updates
The UK Government's Electric Car Grant offers point-of-sale discounts of up to £3,750 on eligible new zero-emission cars, with more than 60 models qualifying across two discount bands as of 11 August 2026. Refer to the official GOV.UK page for the full confirmed list.
For a full breakdown of the scheme and how it works, see our Electric Car Grant guide.
Source: GOV.UK
ZEV Mandate: 2026 progress
The ZEV Mandate sets annual targets for zero-emission vehicle sales as a proportion of each manufacturer's total registrations, as of the UK government's drive to phase out the sale of new petrol and diesel cars by 2030. The target for 2026 is 33%.
- BEVs held a 25.3% YTD market share through July 2026, approximately 7.7 percentage points short of the mandate threshold.
- The SMMT's July 2026 outlook revised the full-year 2026 BEV forecast to 27.4%, up from 26.8% in the April outlook. At the revised forecast, the market would end 2026 approximately 5.6 percentage points short of the mandate target.
- The SMMT's July 2026 outlook identifies high electricity prices and the planned introduction of eVED from 2028 as concerns. (eVED is a proposed per-mile charge on electricity used to power electric vehicles, designed to replace the fuel duty revenue lost as petrol and diesel car usage declines.)
Source: SMMT
Used BEV market reaches record quarterly share
- Used BEV transactions rose 67.0% in Q2 2026 to 110,761 units, marking the largest quarterly increase since Q1 2024.
- BEVs reached a 5.5% used market share in Q2 2026, up from 3.3% in Q2 2025 and 4.3% in Q1 2026, as a growing pool of electric models enters second-hand supply.
- Growth was strongest in April and May, set against weak Q2 2025 comparables when VED changes came into effect, with June recording a more moderate increase.
New car market share by powertrain (2018-2027)
The table below tracks the powertrain composition of UK new car registrations from 2018 to 2025. Forecast figures for 2026 and 2027 are from the SMMT's July 2026 New Car and Van Outlook.
| Year | BEV | HEV | PHEV | Petrol | Diesel |
|---|---|---|---|---|---|
| 2027 (forecast) | 32.1% | 14.6% | 14.6% | 35.2% | 3.5% |
| 2026 (forecast) | 27.4% | 14.2% | 13.3% | 40.9% | 4.3% |
| 2025 | 23.4% | 13.9% | 11.1% | 46.4% | 5.1% |
| 2024 | 19.6% | 13.4% | 8.6% | 52.2% | 6.3% |
| 2023 | 16.5% | 12.6% | 7.4% | 56.0% | 7.5% |
| 2022 | 16.6% | 11.6% | 6.3% | 55.9% | 9.6% |
| 2021 | 11.6% | 8.9% | 7.0% | 58.3% | 14.2% |
| 2020 | 6.6% | 6.7% | 4.1% | 62.7% | 19.8% |
| 2019 | 1.6% | 4.2% | 1.5% | 66.0% | 26.6% |
| 2018 | 0.7% | 3.4% | 1.9% | 62.3% | 31.7% |
Source: SMMT.
SMMT's new car outlook explained
2026 outlook
- Total new car registrations are expected to reach 2.183 million units, 8% above the 2.021 million achieved in 2025. This is an uplift of approximately 90,000 units on the April 2026 forecast of 2.093 million, reflecting stronger than expected H1 performance.
- BEVs are forecast to reach a 27.4% market share, up from 26.8% in the April 2026 outlook, with volume growing 26.2%.
- PHEVs are projected to reach a 13.3% market share, up from 11.1% in 2025, with volume growing 28.5%.
- HEVs are expected to reach a 14.2% market share, with volume growing 10.8%.
- Petrol and diesel are both forecast to decline, with petrol share falling to 40.9% from 46.4% in 2025 and diesel to 4.3% from 5.1%.
2027 outlook
- Total new car registrations are anticipated to reach 2.245 million units, a 2.9% increase on the 2026 projection.
- BEVs are projected to reach a 32.1% market share, compared with the ZEV Mandate's 38% target for 2027. PHEVs are forecast at 14.6% and HEVs at 14.6%.
- Petrol is projected to fall to 35.2% and diesel to 3.5%.
Source: SMMT
Resale value of used EVs
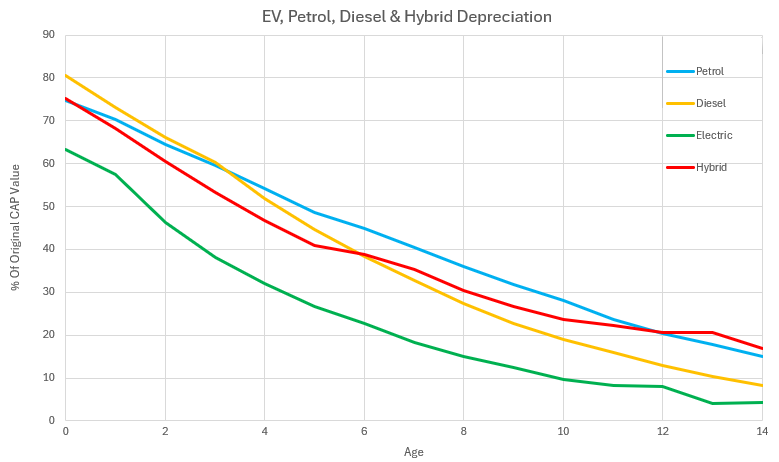
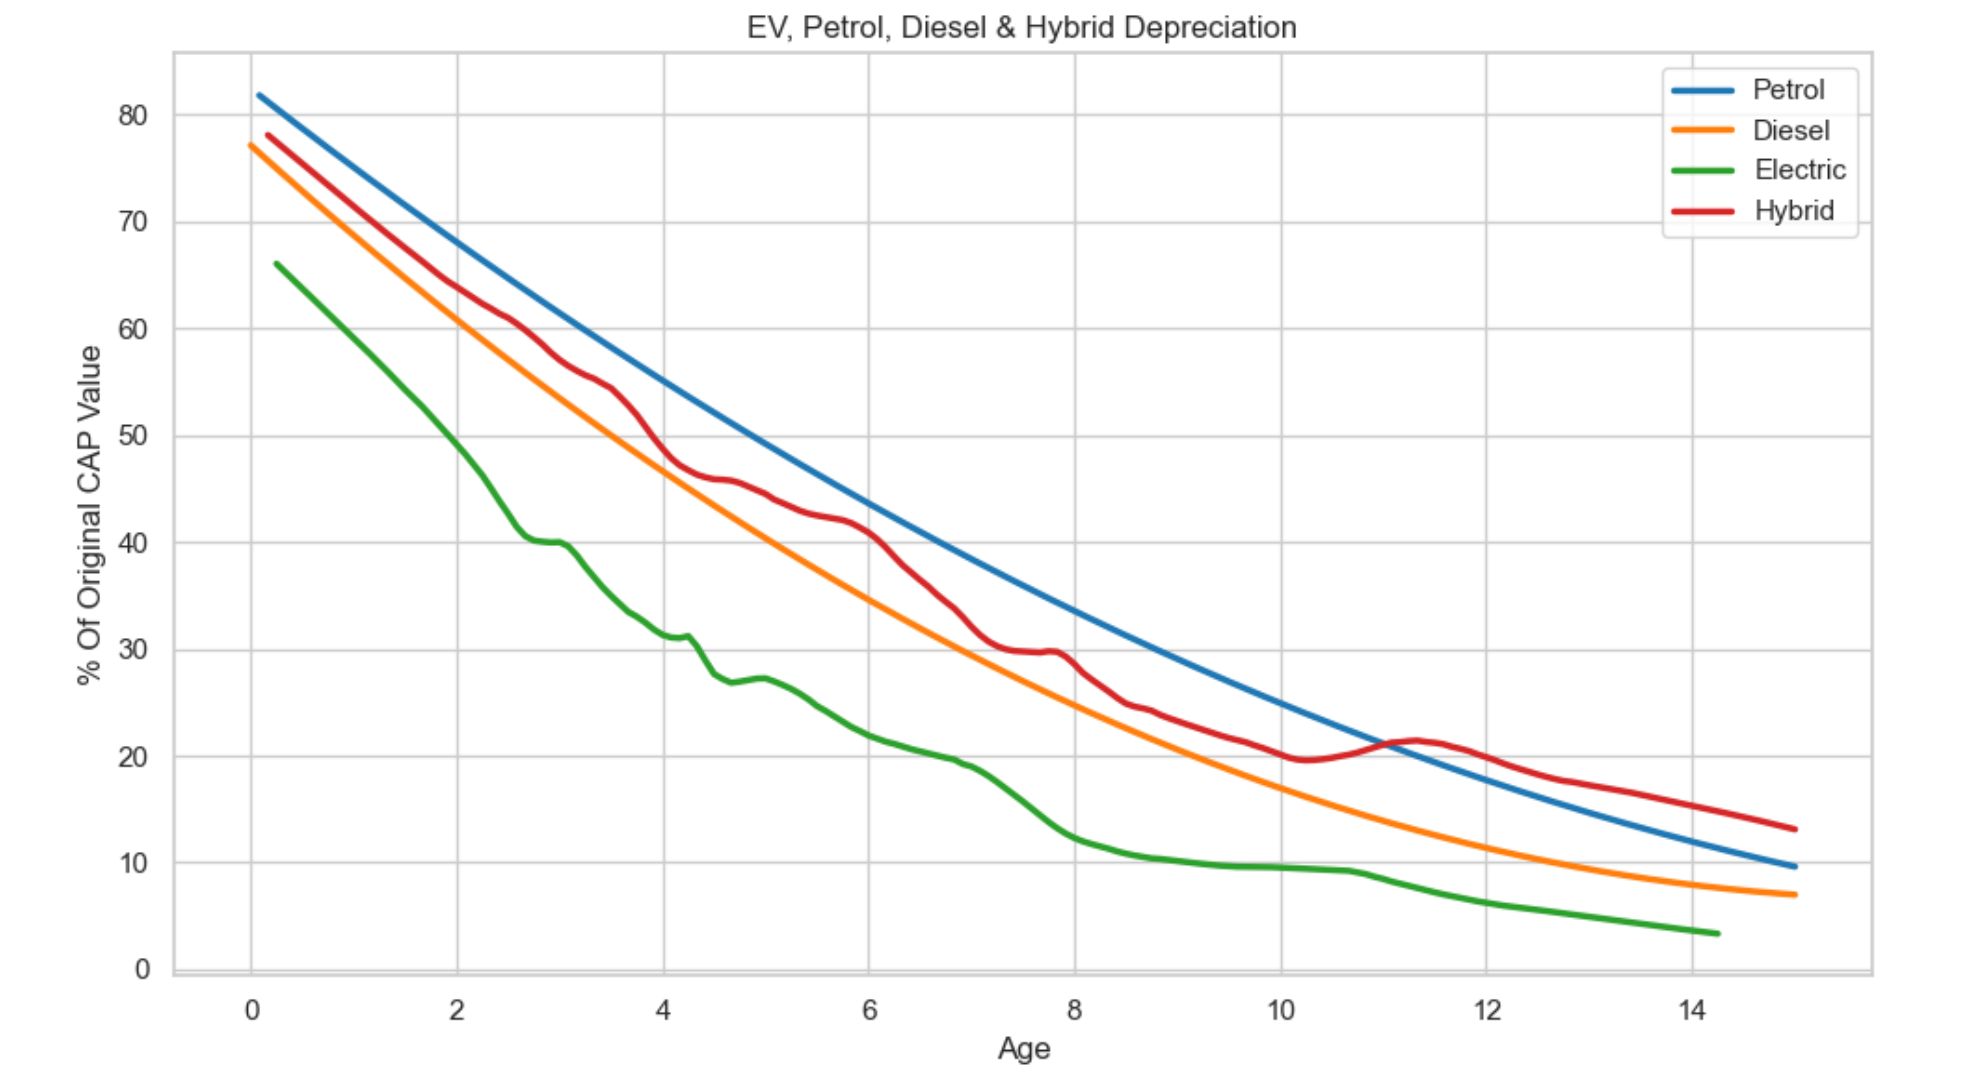
In May 2026, webuyanycar published updated data on average depreciation rates across powertrain types. The chart below compares the average EV's depreciation against petrol, diesel, and hybrid vehicles, and shows how the picture has changed since the previous dataset was published in August 2025.
May 2026
August 2025
Key findings
- On average, EVs lose approximately 36% of their value at year zero and around 54% after two years. Our August 2025 data showed losses of approximately 34% and 50% at those same intervals.
- The average EV retained approximately 32% of its brand-new value at four years in the May 2026 data, compared with around 28% in the August 2025 data.
- Petrol cars show strong values across the full 15-year curve, retaining around 75% at year zero and approximately 15% at year 14.
- Diesel residuals in the zero-to-three-year range are stronger in May 2026 than in August 2025, sitting above petrol at around 81% in year zero – at around 60% in year three.
- Petrol eventually takes the lead around year four.
- Hybrids take second place from around year six – and finally overtake petrol at year 12.
- EVs depreciate faster than all other powertrain types across the full 15-year curve. The gap narrows slightly from around year eight onward.
- EVs with strong brand reputations, higher performance specifications, and longer ranges may hold their value above the segment average.
How has the UK's new EV market share grown over time?
- BEV registrations have grown significantly over the past decade, rising from a niche segment to one of the most common powertrain choices in the new car market.
- In 2016, just 10,264 BEVs were registered in the UK, representing a 0.38% market share, offered across 14 models from 12 brands.
- By 2025, annual BEV registrations had grown to approximately 473,000, with a 23.4% market share. PHEVs added a further 11.1%, bringing the total plug-in share to 34.5%.
- The number of brands offering BEVs has grown from 12 in 2016 to 51 in 2026, with available models rising from 14 to 167.
- The SMMT's July 2026 New Car and Van Outlook projects a 27.4% BEV market share for full-year 2026, revised up from 26.8% in the April outlook, implying approximately 598,000 BEV registrations for the year, more than 58 times the 2016 total.
How many BEVs are there in the UK?
According to Zapmap's EV market tracker, as of the end of July 2026 there were over 2,150,000 fully electric cars on UK roads, representing approximately 6.2% of all licensed cars.
Source: Zapmap
EV chargepoint availability report (Zapmap)
EV chargepoint growth in 2026
- At the end of July 2026, the UK's public EV charging network reached 122,724 EV chargers across 47,441 locations, with 6,672 net new chargers added in 2026 to date and YoY growth of 9.5%.
- In 2025, 13,281 EV chargers were added to the UK public network, a 13% growth in the overall network, though fewer than the 24,557 added in 2024.
- In July 2026, 1,553 net new EV chargers were added to the network. On-street charging locations recorded the strongest growth during the month.
Public charger speeds
From February 2026, Zapmap and the Department for Transport updated their power band naming conventions:
- Standard (3kW to 7.9kW) and Standard Plus (8kW to 49kW) replaced the previous Slow and Fast categories.
- Rapid (50kW to 149kW) and Ultra-rapid (150kW+) are unchanged.
At the end of June 2026, the breakdown by power band was:
- Standard and Standard Plus (3-49kW): 92,284 chargers, +8.0% YoY
- Rapid (50-149kW): 14,891 chargers, +2.0% YoY
- Ultra-rapid (150kW+): 13,996 chargers, +37.0% YoY
Growth in rapid and ultra-rapid chargers
- At the end of July 2026, there were 29,246 rapid or ultra-rapid EV chargers (50kW+) across 7,031 locations, with 359 net new rapid or ultra-rapid chargers added during the month.
- Ultra-rapid chargers (150kW+) grew 37.0% YoY to 13,996 at the end of June 2026, the fastest growing power band.
- The number of rapid charging hubs stood at 1,056 at the end of July 2026, up from 926 at the end of 2025, and 723 at the end of 2024.
Source: Zapmap
Leading rapid and ultra-rapid charging networks (July 2026)
- MFG EV Power: 2,950 chargers, 10.1% market share
- Osprey: 2,529 chargers, 8.6% market share
- InstaVolt: 2,504 chargers, 8.6% market share
Source: Zapmap data (31 July 2026)
Leading public EV charging providers (July 2026)
- Shell Recharge Ubitricity: 14,629
- Pod Point: 8,120
- Connected Kerb: 6,788
Source: Zapmap data (31 July 2026)
Areas with the most EV chargers (July 2026)
Overall
- Greater London: 31,635
- South East: 16,476
- Scotland: 13,015
Rapid and ultra-rapid only
- South East: 4,100
- Scotland: 3,351
- East of England: 3,234
Source: Zapmap data (31 July 2026)
How do EVs work?
How do EVs work?
EVs are powered by one or more electric motors rather than an ICE engine. These motors are powered by a rechargeable battery, which can be replenished by plugging the vehicle into an electric charger.
What factors affect EV performance?
Your real-world electric range may differ from the advertised figure (which often reflects a best-case scenario). Factors that affect EV performance include your driving style, weather conditions - and the degree to which features such as the in-car heating and air conditioning are used.
Smart energy recovery technology
EVs utilise technology that converts kinetic energy into electricity whilst braking or travelling uphill, automatically topping up the battery.
Glossary of EV terms
| Term | Definition |
|---|---|
| YoY | Year-on-year |
| Powertrain | The system responsible for generating a vehicle's power and transferring it to the road. |
| Market share | In the context of these guides, refers to the share of cars sold over a specified period, rather than share of the overall car parc. |
| EV | Electric vehicle |
| BEV | Battery electric vehicle |
| PHEV | Plug-in hybrid electric vehicle |
| HEV | Hybrid electric vehicle |
| MHEV | Mild hybrid electric vehicle |
| ICE | Internal combustion engine |
| ZEV | Zero emission vehicle |
| SMMT | Society of Motor Manufacturers and Traders |
| VED | Vehicle Excise Duty |
| ECS | Expensive Car Supplement |
| ZEV Mandate | A UK Government regulatory framework setting escalating annual targets for zero emission vehicle sales. The target for 2026 is 33% of new car registrations, rising to 80% by 2030. |
| Car parc | The total number of cars in use on UK roads at any given time. |