


UK Car Market Statistics: Q1 and Q2 2026
Published August 13, 2026
- The UK used car market returned to growth in Q2 2026, up 0.7% to 2,009,318 transactions, the first Q2 to exceed two million since 2021.
- New car registrations rose 11.7% YoY in July 2026 to 156,571 units, the strongest July since 2019.
- BEVs achieved a record July volume in 2026, up 44.5% YoY to claim a 27.5% share of new car registrations, up from 21.3% a year earlier.
- The Jaecoo 7 has become the UK's third best-selling new car year-to-date, the first model from a Chinese brand to break into the established top three.
- Used BEV transactions rose 67.0% YoY in Q2 2026 to a record 110,761 units, with a 5.5% market share.
This quarterly guide brings together the latest UK used and new car market data for journalists, industry professionals, and car buyers. It covers used and new car transactions, powertrain trends, best-selling models, fleet and private demand, the UK car parc, and long-term registration trends.
For a detailed breakdown of the UK's electric car market, see our EV market statistics guide.
Get a free valuation
H1 2026 UK used car market analysis
| Period | Transactions | YoY change |
|---|---|---|
| H1 2026 | 4,025,550 | +0.2% |
| H1 2025* | 4,017,516 | n/a |
| Full year 2025 | 7,807,872 | +2.2% |
| Full year 2024 | 7,643,180 | n/a |
Source: SMMT
- H1 2026's total of 4,025,550 is running around 3.1% ahead of the pace set by 2025's full-year figure, a sign the market has more than made up for Q1's early dip.
- Q2 2026 returned to growth at +0.7% YoY, offsetting Q1's marginal -0.2% dip.
- Within the quarter, used BEV transactions rose particularly sharply in April and May, up 110.9% and 57.6% respectively, before moderating to 37.8% growth in June.
- 2025's full-year total of 7,807,872 was the third consecutive year of growth, with 10 of 12 months recording positive YoY movement.
- The average age of the UK vehicle parc stood at 9.7 years as of the SMMT's Q1 2026 release, up from eight years in 2019, a reminder that used car supply depends on a healthy new car market upstream.
webuyanycar's head of technical services, Richard Evans said:
“A return above two million transactions in Q2 2026 shows the used market has shaken off its early-year hesitancy. The first half of 2026 is running ahead of last year's pace, and that's a healthy sign for a sector that most buyers still rely on far more than the new car market.”
“What's changing underneath that headline figure is the powertrain mix. Petrol remains the anchor and will for some time, but the growth we're seeing in used BEV and HEV volumes reflects a genuine and accelerating shift in what's coming through from new car registrations two or three years ago.”
Source: SMMT
Used car sales Q2 2026: Breakdown by powertrain
| Fuel type | Q2 2026 | YoY change | Share Q2 2026 |
|---|---|---|---|
| Petrol | 1,121,243 | -1.2% | 55.8% |
| Diesel | 620,045 | -7.2% | 30.9% |
| HEV | 130,825 | +31.2% | 6.5% |
| BEV | 110,761 | +67.0% | 5.5% |
| PHEV | 22,856 | -6.8% | 1.1% |
| Total | 2,009,318 | +0.7% |
Source: SMMT
- Petrol held a 55.8% share in Q2 2026 used transactions, remaining the largest fuel type despite volumes falling -1.2% to 1,121,243.
- Diesel fell -7.2% in Q2 2026 to 620,045, which the SMMT attributes to shorter supply from the new car market.
- BEVs grew +67.0% in Q2 2026 to a record 110,761 transactions and a record 5.5% market share, up from 3.3% a year earlier.
- HEVs were the largest electrified category by volume in Q2 2026 at 130,825 transactions, up +31.2%, increasing their market share to 6.5% from 5.0% a year earlier.
- PHEV transactions fell -6.8% in Q2 2026 to 22,856 units, comprising 1.1% of the used market, down from 1.2% a year earlier.
- Combined electrified vehicles (BEV, HEV, PHEV) accounted for 13.2% of Q2 2026 used transactions, up from approximately 9.9% in full-year 2025.
Used car trends
- Superminis remained the UK's most popular used car type in Q2 2026, holding a 31.7% share as volumes rose 0.2%.
- The lower medium segment followed with a 26.6% share, also up 0.2%.
- Dual purpose vehicles recorded the strongest segment growth in Q2 2026, up +7.4% to secure a 17.7% share.
- Cox Automotive's baseline forecast projects 7,815,565 used car transactions for full-year 2026, a marginal +0.1% increase on 2025, pointing to an essentially flat market.
Source: SMMT
Best-selling used cars Q2 2026 vs 2025
| Best-selling models Q2 2026 | Transactions | Best-selling models Q2 2025 | Transactions |
|---|---|---|---|
| Ford Fiesta | 73,570 | Ford Fiesta | 76,486 |
| Vauxhall Corsa | 59,247 | Vauxhall Corsa | 62,905 |
| Volkswagen Golf | 55,786 | Volkswagen Golf | 58,144 |
| Ford Focus | 52,283 | Ford Focus | 55,333 |
| Volkswagen Polo | 38,972 | Mini | 41,887 |
| Mini | 38,694 | BMW 3 Series | 41,832 |
| Nissan Qashqai | 38,333 | Volkswagen Polo | 38,642 |
| BMW 3 Series | 38,104 | Vauxhall Astra | 38,188 |
| Vauxhall Astra | 33,935 | Nissan Qashqai | 36,161 |
| Audi A3 | 32,614 | Audi A3 | 32,135 |
Source: SMMT
- The top four models are identical in both periods, with the Fiesta, Corsa, Golf, and Focus holding their positions. All four recorded YoY volume declines despite the overall Q2 2026 market returning to growth.
- The Ford Fiesta's continued lead is notable given that production ended in 2023. Its long run and historically high new car volumes mean millions remain in circulation at accessible price points.
- The most notable shift is the Nissan Qashqai, rising from ninth in Q2 2025 to seventh in Q2 2026, consistent with the quarter's strongest-growing segment, dual purpose vehicles.
- The Volkswagen Polo rose from seventh to fifth over the same period, while the Mini and BMW 3 Series both slipped two places.
- The Audi A3 held 10th place in both periods, with a small YoY increase in volume.
- The Nissan Qashqai remains the only SUV or dual purpose model in the top 10; the remaining nine positions are held by hatchbacks, superminis and saloons, though the Qashqai's continued climb reflects the gradual shift in used market composition.
Used car market predictions for 2026
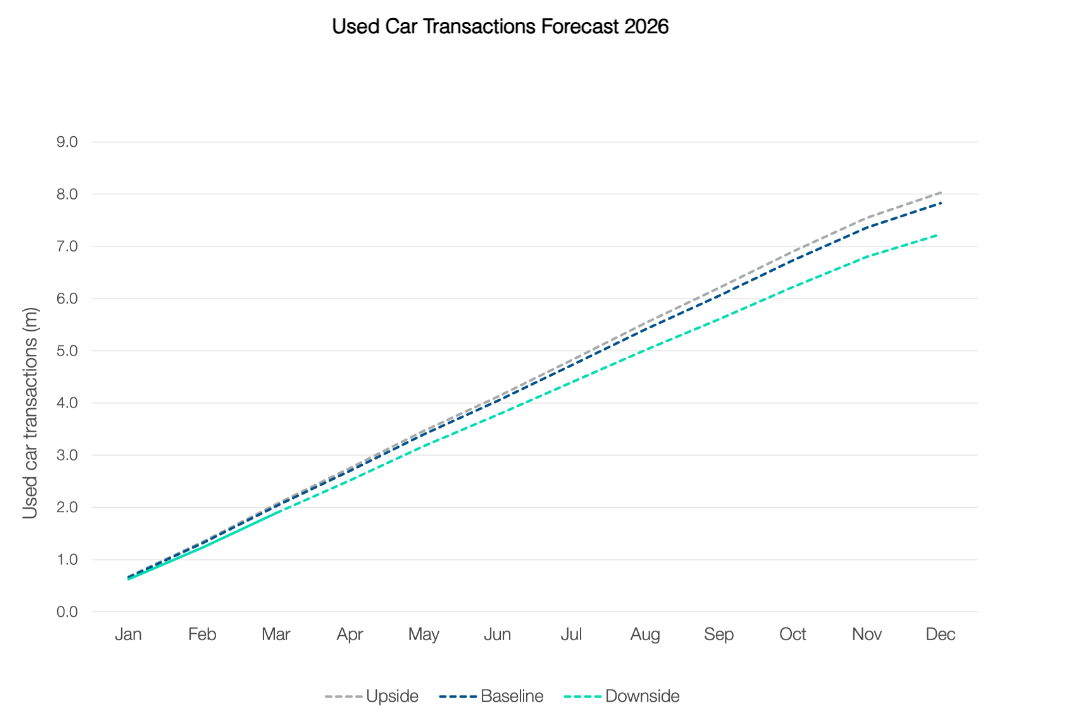
Source: Cox Automotive.
| Scenario | 2026 projected volume | YoY change vs 2025 |
|---|---|---|
| Upside | 8,070,407 | +3.4% |
| Baseline | 7,815,565 | +0.1% |
| Downside | 7,444,112 | -4.7% |
- Baseline scenario: 7,815,565 transactions, +0.1% on 2025, pointing to an essentially flat market for the remainder of the year.
- Upside scenario: 8,070,407 would return the market above eight million for the first time since the pandemic.
- Downside scenario: 7,444,112 would represent a -4.7% contraction on 2025's volume.
New car market statistics: July 2026
New car registrations rose 11.7% year-on-year in July 2026 to 156,571 units, the best performance since 2019.
The increase came against a relatively weak July 2025, when registrations fell -5.0% to 140,154 units as some buyers held off pending confirmation of Electric Car Grant model eligibility.
| Powertrain | July 2026 | July 2025 | % change | Share 2026 | Share 2025 |
|---|---|---|---|---|---|
| BEV | 43,106 | 29,825 | +44.5% | 27.5% | 21.3% |
| HEV | 20,711 | 18,551 | +11.6% | 13.2% | 13.2% |
| PHEV | 23,359 | 17,489 | +33.6% | 14.9% | 12.5% |
| Petrol | 62,799 | 66,271 | -5.2% | 40.1% | 47.3% |
| Diesel | 6,596 | 8,018 | -17.7% | 4.2% | 5.7% |
| Total | 156,571 | 140,154 | +11.7% |
Source: SMMT
Please note: MHEV registrations are included within petrol and diesel figures.
Powertrain trends
- Electrified vehicles (BEV, PHEV, HEV) accounted for an estimated 55.6% of July 2026 registrations (derived by summing SMMT's stated individual shares), continuing to outnumber petrol and diesel models.
- PHEVs recorded the strongest proportional growth at +33.6%, reaching a 14.9% share, an observation consistent with plug-in hybrid technology continuing to gain traction as a transition step.
- BEVs achieved a record July volume, up 44.5% to 43,106 units, claiming a 27.5% share. Year-to-date, BEVs hold a 25.3% share against a ZEV Mandate target of 33% for 2026.
- Petrol volumes fell -5.2% to 62,799, with market share dropping from 47.3% to 40.1%.
- Diesel fell -17.7% to 6,596, covering just 4.2% of the market, continuing its decline.
The gap between fleet and private demand
| Channel | July 2026* | July 2025 | % change | Share 2026 | Share 2025 |
|---|---|---|---|---|---|
| Private | 58,153 | 51,646 | +12.6% | 37.1% | 36.8% |
| Fleet | 93,725 | 85,594 | +9.5% | 59.9% | 61.1% |
| Business | 4,701 | 2,914 | +61.3% | 3.0% | 2.1% |
| Total | 156,571 | 140,154 | +11.7% |
Source: SMMT
- Private demand grew 12.6% in July 2026 to take a 37.1% share, while fleet grew 9.5% to retain the largest share of the market at 59.9%, down marginally from 61.1% a year earlier.
- Business registrations rose 61.3% year-on-year, though from a much smaller base, taking around 3.0% of the July 2026 market.
webuyanycar's head of technical services, Richard Evans said:
“Fleet and private demand are both growing, but private buyers are doing more of the heavy lifting this time round. That's a welcome shift after a period where fleet incentives did most of the work in pushing electrified vehicles into the market.”
“Both the used market and schemes like the Electric Car Grant are giving private buyers new ways into electrification, whether that's a more affordable used EV or extra support towards a new one. July's figures suggest more private buyers are starting to make that switch.”
Thinking of selling your EV, petrol, diesel, or hybrid car? Enter your reg and mileage into our free car valuation tool to get a quote in under 30 seconds.
New car market trends: January to July 2026
| Powertrain | YTD 2026 | YTD 2025 | % change | Share 2026 | Share 2025 |
|---|---|---|---|---|---|
| BEV | 327,683 | 254,666 | +28.7% | 25.3% | 21.5% |
| HEV | 182,387 | 165,328 | +10.3% | 14.1% | 14.0% |
| PHEV | 171,491 | 124,528 | +37.7% | 13.3% | 10.5% |
| Petrol | 553,794 | 571,111 | -3.0% | 42.8% | 48.3% |
| Diesel | 59,144 | 66,740 | -11.4% | 4.6% | 5.6% |
| Total | 1,294,499 | 1,182,373 | +9.5% |
Source: SMMT
- PHEVs recorded the strongest YTD growth at +37.7%, with market share rising 2.7 percentage points from 10.5% to 13.3%.
- Petrol and diesel combined accounted for approximately 47.3% of new car registrations YTD through July 2026 (derived from SMMT's stated volumes), down from 53.9% a year earlier, continuing electrified vehicles' shift in share.
- Cox Automotive's Q2 baseline forecast projects 2,193,547 full-year registrations, an 8.6% increase on 2025, broadly in line with SMMT's own July 2026 outlook of 2.183 million, also up 8% on 2025. Cox's downside scenario for 2026 is 1,996,174 (-1.2% on 2025) and its upside scenario is 2,339,005 (+15.8% on 2025).
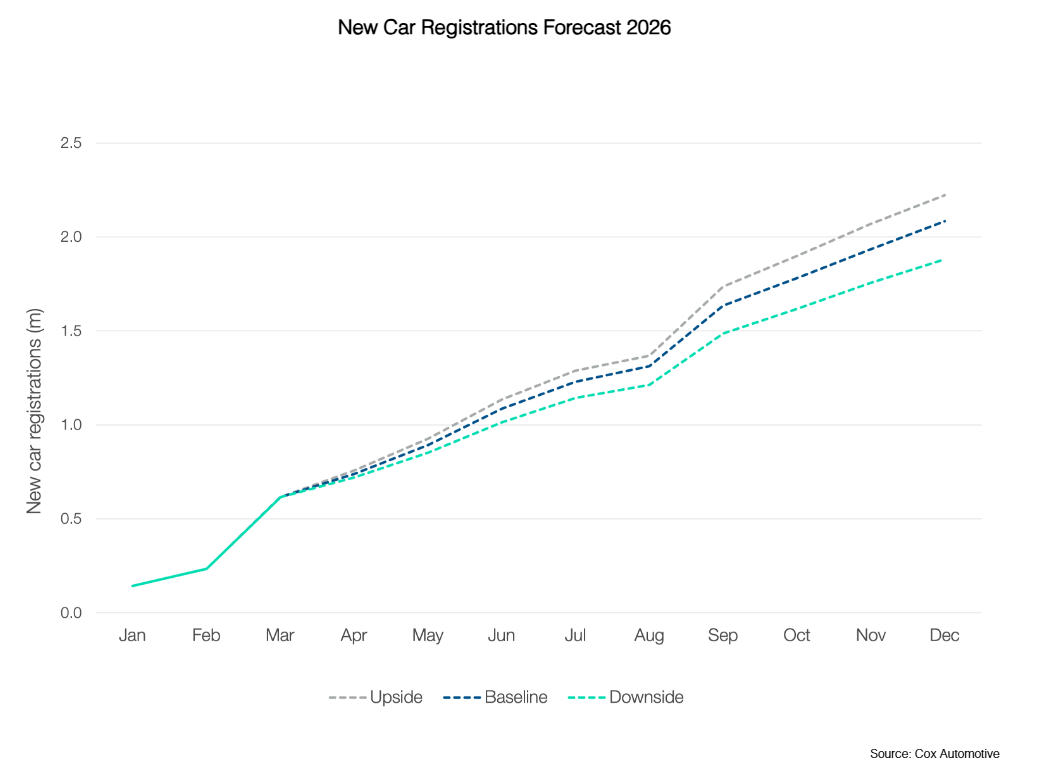
Sources: SMMT, Cox Automotive
ZEV Mandate: targets and market reality
- The ZEV Mandate requires 33% of each manufacturer's 2026 new car registrations to be zero-emission. The market-wide BEV share stands at 25.3% YTD through July, 7.7 percentage points below that mark.
- The SMMT's latest outlook (July 2026) revised its full-year BEV market share forecast up from 26.8% to 27.4%. At the revised forecast, the market would end 2026 around 5.6 percentage points below the mandate target.
Sources: SMMT
Best-selling new car models YTD 2026 vs 2025
| YTD 2026 (Jan–Jul) | Registrations | YTD 2025 (Jan–Jul) | Registrations |
|---|---|---|---|
| Ford Puma | 33,173 | Ford Puma | 30,764 |
| Kia Sportage | 29,033 | Kia Sportage | 27,494 |
| Jaecoo 7 | 26,549 | Nissan Qashqai | 24,529 |
| Nissan Qashqai | 26,326 | Vauxhall Corsa | 20,796 |
| Vauxhall Corsa | 22,196 | Nissan Juke | 21,604 |
| Volkswagen Golf | 19,965 | Volkswagen Golf | 18,974 |
| MG HS | 19,424 | MG HS | 17,793 |
| Mini Cooper | 18,645 | Volkswagen Tiguan | 17,750 |
| Volvo XC40 | 18,118 | Peugeot 2008 | 17,605 |
| Volkswagen Tiguan | 16,898 | Hyundai Tucson | 17,249 |
Source: SMMT
- The Ford Puma leads YTD in both periods, extending its best-seller status from 2024 and 2025, with volumes up 7.8% year-on-year. Its availability in a fully electric variant, the Puma Gen-E, broadens its appeal across fleet and private channels.
- The Jaecoo 7 is a significant new entry, taking third place in 2026 YTD with 26,549 registrations against no presence in the YTD 2025 top 10, pushing the Nissan Qashqai down to fourth despite the Qashqai's own volume growing 7.3%. The Chery Group brand entered the UK market in 2024.
- The Nissan Juke, Peugeot 2008 and Hyundai Tucson all drop out of the 2026 YTD top 10, replaced by the Jaecoo 7, Mini Cooper and Volvo XC40.
- Seven of the top 10 are SUV or dual purpose models (Puma, Sportage, Jaecoo 7, Qashqai, MG HS, Volvo XC40, Tiguan), against three hatchbacks or superminis (Corsa, Golf, Mini Cooper). No pure BEV features in the top 10, though the BEV segment holds a 25.3% market share YTD, spread across a wide range of models at lower individual volumes.
How many cars are there in the UK?
According to DVLA vehicle licensing statistics, at the end of March 2026 there were approximately 34,627,400 licensed cars on UK roads, a marginal increase on the 34,485,500 recorded at the end of December 2025.
UK new car sales statistics (2011-2027)
| Year | Registrations |
|---|---|
| 2027* | 2,245,000 |
| 2026* | 2,183,000 |
| 2025 | 2,020,520 |
| 2024 | 1,953,420 |
| 2023 | 1,903,054 |
| 2022 | 1,614,063 |
| 2021 | 1,647,181 |
| 2020 | 1,631,064 |
| 2019 | 2,311,140 |
| 2018 | 2,367,147 |
| 2017 | 2,540,617 |
| 2016 | 2,692,786 |
| 2015 | 2,633,503 |
| 2014 | 2,476,435 |
| 2013 | 2,264,737 |
| 2012 | 2,044,609 |
| 2011 | 1,941,253 |
*Forecast figures for 2026 and 2027 are from the SMMT's July 2026 New Car and Van Outlook and are projections, not actuals.
Car market glossary
| Term | Definition |
|---|---|
| YoY | Year-on-year |
| YTD | Year-to-date |
| Powertrain | The system responsible for generating a vehicle's power and transferring it to the road |
| Market share | Share of cars sold or registered over a specified period, not share of the overall car parc |
| BEV | Battery electric vehicle |
| PHEV | Plug-in hybrid electric vehicle |
| HEV | Hybrid electric vehicle |
| MHEV | Mild hybrid electric vehicle |
| ICE | Internal combustion engine |
| DPV | Dual purpose vehicle |
| SMMT | Society of Motor Manufacturers and Traders |
| DVLA | Driver and Vehicle Licensing Agency |
| VED | Vehicle Excise Duty |
| ECS | Expensive Car Supplement |
| ZEV | Zero emission vehicle |